MIPI PTI™
MIPI Parallel Trace Interface
.png?width=1200&height=600&name=Banner%20Images%20-%20MIPI%20(26).png)
Developed by: Debug Working Group
A parallel trace interface with multiple data signals and a clock
Quick Facts
-
Debug & Trace Portfolio
MIPI Alliance has a family of specifications that can be used to debug components in mobile devices as well as any device that is “smart” or connected, such as an end-point on the Internet of Things. Components that can be debugged with the tools include application processors, modems, device controllers, power management devices, and others.
All of these specifications are available for download and use by the public and the open source community.
Get the Specification
-
Current Version
MIPI PTI℠ v2.0.1 (July 2022)
Member version | Public version
-
Previous Versions
MIPI PTI℠ v2.0 (October 2011)
Member version | Request public version
All PTI versions are available to MIPI members on the member website (Causeway).
Overview
General Info
-
Overview
The MIPI Parallel Trace Interface, or MIPI PTISM, is a parallel interface with multiple data signals and a clock that can be used to export data about system functionality and behavior to a host system for analysis and display. Since the data exported on this interface often allows developers to reconstruct (or “trace”) some portion of system activity, these types of interface have commonly been referred to as “trace Interfaces” or “trace ports.”
MIPI PTI was developed by the MIPI Debug Working Group and released in October 2011. All MIPI debug and trace specifications, including MIPI PTI, are available for download and use by the public and the open source community. Members of the MIPI Alliance enjoy benefits including access to relevant licenses and opportunities to participate in development activities, interoperability workshops and other events.
For information about MIPI Alliance membership, visit Join MIPI.
-
Data Examples
Examples of this data include:
- The instruction execution sequence for one or more embedded processors (commonly referred to Program Counter (PC) Trace).
- Data bus transactions made by an embedded processor core (commonly referred to as Data Trace).
- Snapshots of transactions on the system interconnect(s) (commonly referred to as System Trace).
- Streaming output from instrumented application code (commonly referred to as Instrumentation Trace).
A typical embedded system may have one or more HW modules that produce trace data.
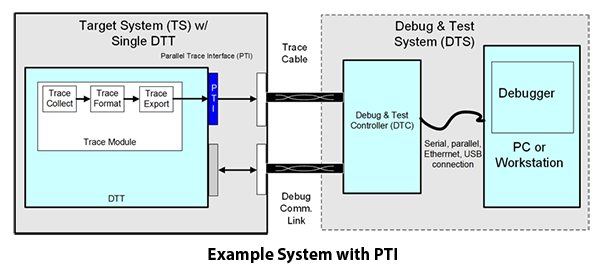
- The DTC captures the data.
- The data is decoded and analyzed using the DTS.
-
Latest Release
Version 2.0 of MIPI PTI expands the interface description to include a shared trace connection where multiple PTI interfaces are merged through a single connector on a PCB board. Multi-point PTIs are very useful for supporting trace on fielded systems that have multiple trace-enabled ASICs but only a single connector (with limited data pins) for interfacing to an external DTC. A standard example would be a mobile terminal with an application and modem SoC and a single MIPI NIDnT connection.
-
Diagrams & Tables
Debug Capabilities per Adjacent Industries
(best viewed on desktop)
Example System with PTI
(click to enlarge)
Industries


