3 min read
Standardizing Debug and Trace Interfaces for a Rapidly Evolving Mobile World
![]() Enrico Carrieri, Chair of the MIPI Debug Working Group
:
4 January 2019
Enrico Carrieri, Chair of the MIPI Debug Working Group
:
4 January 2019
- News & Events
- News
- Blog
Today, signals and interfaces that used to be visible at test points on a PCB are now embedded in SoCs, so for those of us involved in debug and trace, it’s made our work much more difficult. Of course, new techniques have emerged, but dealing with these separate approaches often adds work and slows time to market.
To streamline development, the industry needs to converge on common interfaces and protocols used by these new technologies. Within the MIPI Debug Working Group (Debug WG), we’ve been taking on that task.
Over the last several years, we’ve created a broad portfolio of standards and recommendations available to product developers and tool vendors. If you want to learn more or get involved, check out the Debug WG webpage.
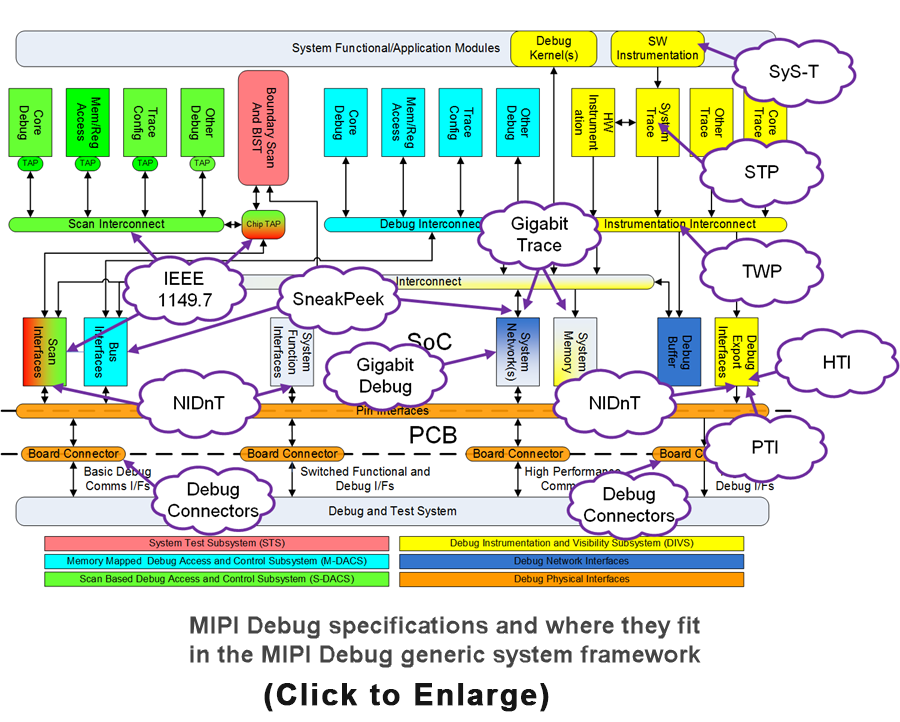
To help others better understand our approach, we recently updated our debug architecture white paper. In it, we describe our solutions in detail and lay out the benefits of each.
A Portfolio to Address Many Pain Points
The white paper introduces 12 MIPI Debug specifications and provides recommendations spanning all parts of a debug architecture, from debug and test systems (DTS) to applications on a target system.
Here's a look at some of the highlights.
NIDnT: Use Debug Tools on Production and Near-Production Devices
MIPI NIDnTSM (Narrow Interface for Debug and Test) gives developers a way to use functional interfaces commonly found in devices, such as MicroSD and USB, for debug and test.
In the final stage of development, most devices no longer have dedicated interfaces such as serial ports for connecting to a DTS, so it's impossible to carry out debug or trace at this point. It's possible to include a proprietary JTAG connector that can be exposed by removing the case or battery cover, but doing this can cause new bugs and either hide or create RF interference.
NIDnT allows for dual use of interfaces included in the final product, multiplexing debug signals with normal function signals. At any given time, either the normal function or the debug function is connected to the functional interface.

Figure 1: A system with a dedicated debug interface (left) and one with NIDnT capability (right)
A NIDnT interface running over a functional interface can connect to a standard MIPI Debug connector through an adapter, exposing a finished product to standard debug and test tools.
NIDnT supports reuse of these functional interfaces:
- USB Type-C
- USB 2.0
- HDMI
- DisplayPort
System Trace Protocol (STP): Implement Trace Protocols More Easily and Accurately
MIPI STPSM is a generic base protocol for real-time trace that supplies features common to a diverse set of protocols used in this area. It can simplify the creation and use of different trace protocols. STP is now in its second generation, STP v2.2, which is backward compatible with the previous version.
The benefits of using STP are:
- Reuse of common features makes it faster and less expensive to design new protocols and related IP and tools
- Sharing features across protocols aids interoperability for requirements like time correlation among trace streams
- Using a proven base protocol prevents mistakes in designing new protocols
With STP v2.2, you can merge trace data from as many as 65,536 independent data sources, or masters, such as processors. Each master can have as many as 65,536 channels, usually applications. STP is intended to coexist with, not replace, highly optimized protocols that convey data about processor program flow, timing and low-level bus transactions.
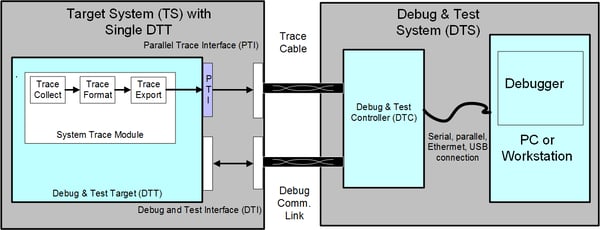
Figure 2: An implementation of STP between a target system and a debug and trace system. STP runs on a system trace module
System Software Trace (SyS-T): OS-independent Software Tracing Protocol
MIPI System Software Trace (Sys-TSM) is a format for transporting software traces and debugging information between target system (TS) running embedded software, and a DTS, typically a computer running one or more debug and test applications (debuggers and trace tools).
Platforms/SoCs contain many different software agents, and for different operating systems, there exists different, specific tracing solutions. SyS-T fills the gap by providing a common, platform-independent general-purpose trace protocol solution existing across the different software/firmware and hardware agents. SyS-T is suitable for trace data generation from non-OS, bare-metal environments, as well as OS kernel and user mode software.
Besides providing the specification, MIPI also provides an open-source instrumentation library on GitHub. This portable C-language-based software library provides a function style API to software using pre-processor macros. It defines a variety of trace messages, ranging from simple UTF-8 based text and printf() style messages to complex binary data payloads.
This library serves as the reference implementation for a SyS-T Data Protocol generator.
High-Speed Trace Interface (HTI): More Speed with Fewer Pins
As CPUs get more cores and faster clock speeds, ports that transfer trace data off-chip from embedded microprocessors need higher performance. Meanwhile, manufacturers want to cut costs and increase integration by minimizing the number of I/O pins the ports use.
MIPI HTISM uses high-speed serial technology to provide high bandwidth while using fewer pins than a parallel port. It reuses the low-level physical portions of those interfaces in a bare-metal environment.
The HTI specification includes a LINK layer, a PHY layer, and a programmer's model. HTI transmits a single stream of trace data over a channel consisting of one to eight high-speed serial lanes. It can transmit either of two MIPI protocols: STP or TWP (Trace Wrapper Protocol).
These are just a few highlights from the MIPI Debug white paper. Other specifications covered include MIPI Parallel Trace Interface (PTISM), MIPI Trace Wrapper Protocol (TWPSM) and Gigabit Debug for USB and Internet Protocol Sockets.
To learn more, download the full paper. Members can also become involved by visiting the Debug WG webpage.


